Silencing the Span

The noise canyon

What the corridor under the Manhattan Bridge actually looks like, drawn from open data rather than sketched
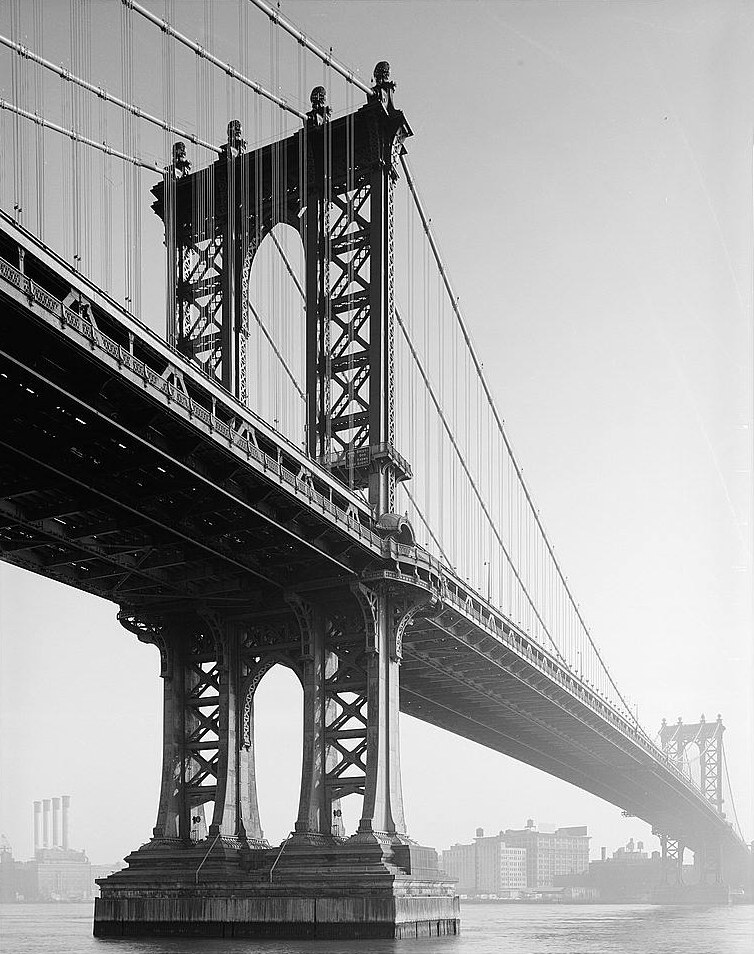
Black and white photograph of the Manhattan Bridge from the water below and to the side, showing the Brooklyn tower, the suspension cables, and the open steel truss soffit of the deck carrying the subway tracks.

The object

This is the thing that makes the noise, photographed from below

Everything else on this page is drawn. This is not. It is a Historic American Engineering Record plate of the same structure the rest of the site models, and the important thing in it is the underside: an open steel truss with no soffit, no absorption and nothing between the rail and the air below it.

  • A closed box girder radiates far less than an open truss, because an open truss lets structure-borne sound out on every face. What this photograph shows is the geometry the mitigation literature is least optimistic about.
  • The frame is at the river towers. Two hundred metres to the left of this view the same soffit is thirty metres above a public park and a residential street grid, and nobody has photographed that face for a survey.

Drawn from

Where this is weak

This is a photograph of the river span, not of the DUMBO approach. It is included because it shows the construction of the deck honestly and because no comparable public photograph of the soffit over DUMBO exists. Reading the acoustic behaviour of one from the other is exactly the inference this repository keeps warning about, so treat it as an illustration of the structural type and not as evidence about the approach.
Isometric massing of the DUMBO corridorSurveyed building footprints extruded to measured roof heights, with the inferred Manhattan Bridge alignment running between them.DUMBO Archway81.33 dB(A) Leq · 91.80 dB(A) average maximum100 m along the alignmentTHE CANYON THE TRAINS RUN DOWNDUMBO and Vinegar Hill, looking north-west along the alignment76 buildings, every height surveyedmean 27 m · tallest 99 m · mean within 90 m of the track 31 mELEVATED STRUCTURE — position inferred, 2/5no public source gives its height over DUMBO

The canyon, 2026

The trains run down a corridor of buildings, not across open ground

Every block in this drawing is a real footprint at its surveyed roof height. Nothing is stylised and nothing is placed by eye. The bridge enters Brooklyn and immediately runs between two walls of masonry and glass.

  • A source over open ground loses about 6 dB per doubling of distance. A source in a canyon does not, because the sound that would have left keeps arriving back off the facades.
  • This is why the DUMBO problem is not the same problem as the river span, even though it is the same train on the same track.

Drawn from

Where this is weak

The buildings are surveyed. The bridge is not. No public source gives the deck elevation over DUMBO, so the structure is drawn on this repository's own inferred alignment and is rated 2/5. In a drawing about noise, the one object making the noise is the least well described thing in it.
Section across the DUMBO corridor at the ArchwaySurveyed building heights either side of a hatched band marking the assumed position of the elevated structure.0 m20 m40 m60 m91 m between the nearest facades28 m25 mELEVATED STRUCTUREASSUMED 20–32 m · 1/5A SECTION CUT ACROSS THE CORRIDORat the DUMBO Archway, looking north-west along the track18 buildings cut by this planemean flanking height / street width = 0.29The MTA measured 81.33 dB(A) Leq and 91.80 dB(A) average maximum at this cut. Every height here is surveyed except the hatched one.

Section

A cut across the corridor, with the only unmeasured object in it drawn as a guess

Cut the corridor at right angles near the Archway and the geometry is a street canyon with a noise source suspended in it. The flanking heights come from the city's own building survey. The height of the deck between them does not exist in any public dataset.

  • The ratio that governs a street canyon is height over width. It is computable here for the buildings and not computable for the source.
  • Drawing the deck as a hatched band rather than a line is the honest rendering of a number nobody has published.

Drawn from

Where this is weak

The deck band is ASSUMED, rated 1/5. It is placed to be plausible, not because a source supports it. Method 16 exists to replace it and has not been run.
Plan of the walk from York Street to Pier 1A routed pedestrian path through DUMBO with the four MTA measurement locations marked.MANHATTAN BRIDGEYork Street F station0 m along the walkPier 1 promenade1482 m along the walkHigh St (A,C)MEASURED HEREevery session the MTA has publishedBrooklyn Bridge Park, Main Street section87.50 dB(A) Leq · 98.90 maxDUMBO Archway81.33 dB(A) Leq · 91.80 maxFront and Pine Streetno Leq published · 94.40 maxAdams Street Library84.65 dB(A) Leq · 98.10 maxSTATIONWALKING ROUTE, dots every 100 mBRIDGE CORRIDOR, alignment inferred© OpenStreetMap contributors, ODbLA TYPICAL WALK INTO DUMBOYork Street F station to Pier 1, 1482 m, routed over the OpenStreetMap footway network

The approach

The walk from the York Street F platform to the water, and along it

This is the ordinary way into the neighbourhood: out of the York Street F station, north-west to the river, then left along the water. The route is not drawn by hand. It is the shortest walkable path over OpenStreetMap's own footway network between fixed waypoints, so anyone can re-derive it.

  • Google Maps is deliberately not used here. Its terms forbid the derivative work, and a picture nobody else can regenerate is not a source.
  • The four circles are every point on this walk where anyone has ever put an instrument.

Drawn from

Where this is weak

The route is a plausible ordinary walk, not an observed one. Nobody has surveyed where people actually go, which is Method 28 and is the single blocking unknown for any absolute exposure figure.
Measured coverage along the walkA strip along the walking route showing four measured bands against an otherwise unmeasured field.60 dB(A)70 dB(A)80 dB(A)90 dB(A)100 dB(A)CEQR 65CEQR 8098.1Adams Street Library207 m from the station94.4Front and Pine Street225 m from the station30 m off the route91.8DUMBO Archway394 m from the station98.9Brooklyn Bridge Park, Main Street section770 m from the stationYork Street F stationPier 1WHAT HAS BEEN MEASURED ALONG THIS WALKbars are the MTA's own sessions, drawn as wide as the uncertainty in where they were347 m of 1482 m23.4 per cent of the walkThe shaded field is not quiet. It is unmeasured, which is a different thing and the whole point.

The gap

Along that entire walk, four points have been measured and nothing else has

Laid out along the walk, the measured evidence occupies four narrow bands. Everything between them is inference. The programme's central claim is not that the noise is loud; it is that almost nobody has checked where it stops being loud.

  • This is the picture that Method 31, the decay transect, is designed to delete. One afternoon with one meter and a tape closes most of it.
  • A propagation model over these four points was fitted and then withdrawn before publication: jittering the digitised positions by ten metres moves the fitted decay exponent anywhere from 0.7 to 22.3.

Drawn from

Where this is weak

Positions of the four sessions are digitised by eye from the addresses given in the memos and are rated 2/5. The levels are 5/5. The bands are drawn wide enough to show that the position uncertainty is not negligible.
1 of 5

Why there is no Google Maps screenshot here

The obvious way to draw the walk would be to screenshot a mapping service. It is not done, for two reasons and only one of them is legal. The terms of the major services forbid the derivative work. The more important reason is that a picture traced off a proprietary basemap is not a source: nobody else can regenerate it, so nobody else can check it. Every line on these slides comes from a dataset with an identifier, and the code that turns those datasets into these drawings is in this repository.

Adding or removing a slide

The slides are declared in visual-review/carousel.json. Adding one is a single object in the slides array; removing one is deleting that object or setting "enabled": false; reordering is moving it. Then run python build_carousel.py. Artwork is either a named generator in build_carousel.py or an image file. The build refuses to run if a slide has no sources or no caveat, and refuses to run if a generator name is misspelled, so a broken slide cannot ship quietly.

Attribution

Building footprints and heights: New York City OpenData, dataset 5zhs-2jue. Streets, footways, park and water geometry, and the bridge alignment: © OpenStreetMap contributors, ODbL 1.0. Measured sound levels: MTA document 138061. Fetch the geodata with python data-collection/fetch_geodata.py.