Silencing the Span

Ethical Tech CoLab · open research programme

Silencing the Span

Rail noise from the NYC Subway crossing the Manhattan Bridge into DUMBO, Brooklyn — measured by the operator, uncomplainable to the city, and unstudied where people actually are.

This is the short version: what the problem is, artifacts you can hear and navigate for yourself, and what has actually been established. The research holds the evidence underneath it — every document, the open questions, the work still to be done, and the claims this programme has had to withdraw. Both pages are regenerated from the repository, so the counts on them cannot drift away from the work.

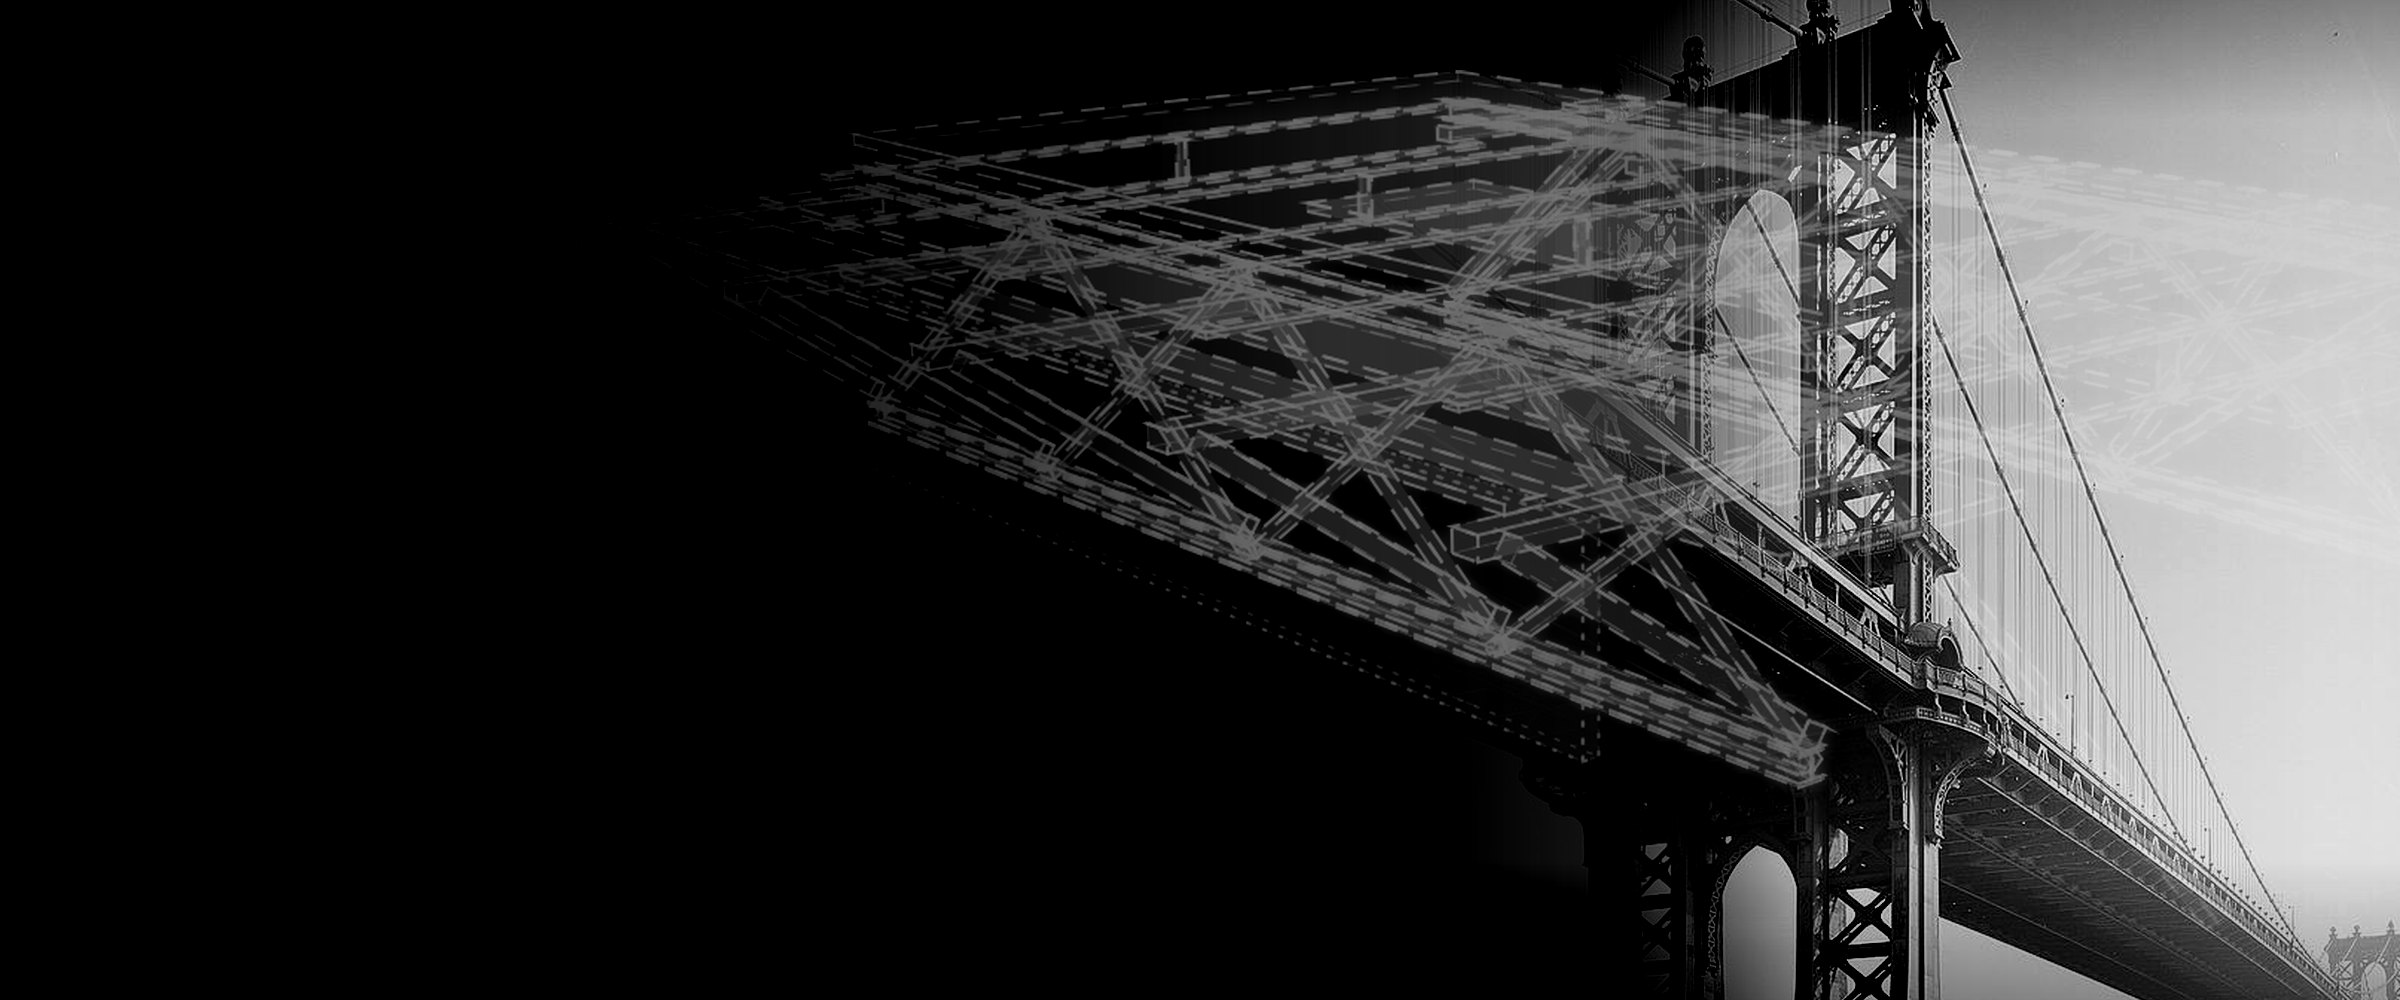
Photograph: Historic American Engineering Record NY-127-7, Jack E. Boucher, National Park Service, via Library of Congress — no known restrictions on images made by the U.S. Government. Overlaid wireframe rendered from this repository's own 3D model, so it is inferred geometry and not a survey. Composited by make_hero.py.

MTA-measured peak, Brooklyn Bridge Park
98.9
dB(A) average maximum
Weekday crossings, busiest hour
67
a train every 54 seconds
People living in the affected corridor
15.8k
to 21.4k, from tax lots
Rail noise complaints NYC 311 can accept
0
there is no category

The first two are the MTA's own figures and are the most reliable numbers here. The third is derived from public tax-lot data. The fourth is the finding this programme did not expect to make.

Read this before anything below it. Nobody from this programme has stood in Brooklyn Bridge Park with an instrument. Every level quoted here was measured by someone else and published; every level modelled here is synthetic. Where the investigation stands sets out how little of the specified work has actually been done.

Start here

Three different readers want three different things.

Interactive demonstrations

Each is a single self-contained HTML file: no build step, no server, no network access, no dependencies, no tracking. Open it here, or download it and double-click. Each applies the same provenance discipline to a different medium.

Acoustic demonstration Audiov0.4.3
Web Audio synthesis pinned to the MTA's own measurements. Six receptors, single pass-by or continuous running at the measured headway, A-weighted meters, CEQR threshold marks and a running energy average.
Start at the Brooklyn Bridge Park dog run, play one pass-by, then switch to continuous at 20x speed and watch the running average settle onto 87.50 - then read why that convergence is a closed loop and not evidence.
Navigable 3D model Bridgev0.4.1
Both bridges, four zoom tiers from the whole crossing down to a single rail fastener, with anchored callouts, click-to-inspect components and a live scale bar that reads in inches at the finest tier.
Turn every provenance filter off. The viewport goes completely empty and the display says so. That is the state of public knowledge.
Provenance-tagged section Bridgev0.4.2
The 2D cross-section of the Manhattan Bridge track zone, every component colour-coded and dash-coded by how well it is actually known, with the source rubric attached to the drawing.
Turn off the DOCUMENTED filter and watch most of the drawing disappear.
Frequency and exposure dashboard Datav0.4.5
Traversals by hour, route and direction across day, evening and night; pedestrian arrivals, departures, walkway flow and residents; and a four-cohort presence model that publishes its own non-identifiability.
Drag the coincidence window from 1 s to 29 s. The answer does not move - which is a finding about the feed, not about the railway.
The noise canyon Bridgev0.4.6
A five-slide picture essay drawn entirely from open data: the structure photographed, 76 surveyed buildings extruded around the alignment, a true section cut across the corridor, the ordinary walk in from the York Street F platform, and every point along it anyone has ever measured.
The last slide. Four narrow bands of measured evidence against 1,482 m of walk - 23% - and the shaded field is not quiet, it is unmeasured.
The walkable model Bridgev0.4.7
DUMBO from the York Street F platform to Pier 1, built from 2,342 surveyed building footprints with surveyed roof heights and the open street and footway network. Three views - an orbiting model, a plan, and eye level at 1.62 m - over one routing graph, and every position on the same local grid as the agent model. It exists to test the coordinates every other page inherited.
The audit table. Two places the population model calls outdoors sit inside a surveyed building footprint, one of them inside an 81 m tower. Nothing has been moved; the measured offset is published beside the original.
Agentic population model Agentsv0.4
Groups - not individuals - enter DUMBO at persona-specific gateways, follow scenario itineraries, contend for capacity and accumulate a noise dose along their actual path. Deterministic, seeded, fully event-logged. A fifth rung models who is standing in that dose and changes nobody's decibels by doing so.
The least mature thing here: the itineraries, the personas and the arrival rates are all invented, so every number it produces is a consequence of an assumption rather than an observation. Look at the rejected-propagation panel - a negative result, and the most important thing on the page.
Field media capture Fieldv0.4.4
Two days of phone video, stills, by-product audio and stopwatch laps under the bridge: level traces, a threshold sweep, the stopwatch laps, and where each capture stood against every point anyone has ever measured - with the operator's stated purpose for each capture carried on the page, because a measurement can only be read for the purpose it was taken for.
The gap is one shield and one calibrated microphone - a UMIK-1 over USB-C, about USD 100-150, ships with a serial-numbered calibration file - and it is what would open the closed loop the acoustic demonstration runs on.
What the version number means. Nothing here is released, so it is not a release tag. It says how far an artifact is from standing on measured ground — the only ranking this programme is entitled to make. v0.4 is inputs invented throughout; the steps above it run through inferred geometry, synthesis pinned to somebody else's published measurements, capture on an uncalibrated instrument, a measured feed carrying an invented population, and open published data; v0.4.7 is surveyed data. The cards are ordered to introduce the problem, not by this number. They are complete and working software; what they are short of is evidence, not features. Nothing reaches 1.0 until the thing it depicts has been measured on site.
A warning that applies to all eight. The 3D model contains zero measured elements. The audio is synthesised, not recorded. The agent model's itineraries are invented. These are instruments for reasoning about a problem, not evidence about it — and each says so in its own interface rather than in a footnote somewhere else.

What has actually been found

1. The problem is documented, and then abandoned

The MTA measured the noise, in DUMBO, at named addresses, and published the levels. The levels are high. Nothing followed. The measurement exists and the response does not, and the gap between those two facts is where this programme lives.

2. Three instruments for recording city noise, and no rail category in any of them

NYC 311 has a complaint descriptor for ice cream trucks and one for “other animals”. It has none for trains. Neither does SONYC, NYU's 150-million-clip urban sound corpus, whose authors state in print that they built their taxonomy from the NYC noise code — which is where the absence originates.

Within 500 m of the park where the MTA measured 87.50 dB(A), residents filed 4,055 noise complaints since 2020 and not one of them can be about the train. That same circle produced 117 complaints about ice cream trucks and 95 about barking dogs. The dogs at the dog run are complainable. The trains over it are not.

This is a mechanism rather than a motive, which makes it testable, and it yields the first remedy in the programme that a resident could act on this month: amending a taxonomy is a far smaller ask than solving the noise.

3. Exposure peaks in the early afternoon — and this programme got that wrong twice first

Exposure is people multiplied by events. Optimising on attendance alone pointed to the weekend afternoon. Optimising on train rate alone pointed to the weekday morning. Both were published here and both are withdrawn. Train rate is nearly flat from 07:00 to 19:00 while the number of people underneath changes by a factor of four, so the product peaks between the two: 14:00 on a weekday, 13:00 Saturday, 15:00 Sunday.

4. A population's composition cannot be recovered from its departure curve

A four-cohort model pins total non-resident presence to about ±10%. The split between workers and visitors inside that total swings by more than half again across thousands of parameter sets that fit the data equally well. A departure curve carries no job titles — someone present for eight hours looks identical whether they came to work or came for the day. On a Saturday the model is explicitly degenerate and says so in its own output.

5. Distance does not order the measurements, and a propagation model was withdrawn before publication

The three near-bridge sites agree with ideal line-source spreading to 0.15 dB, which looks like a result and is not one. Jittering the digitised positions by ±10 m — well inside the error of reading a point off a scanned figure — moves the fitted decay exponent anywhere from 0.7 to 22.3, and the dog run sits 17.3 dB above the fit. The agreement is coincidence.

The model was therefore retracted before it was published rather than after — the first time in this programme that has happened in that order. It is also under review in its own right, at issue #28, because a negative result asserted from four points is as vulnerable to over-claiming as a positive one.

6. Twenty-one years of measurement without mitigation, and a blank cell in a statute helps explain it

The levels have been on the record for two decades. The legal mechanism joining that record to the absence of any remedy is rated 2/5 and written as a question, not a finding — and the document that proposes it names that joint as the first place to attack it, because the finding is elegant and arrived unexpectedly, which is exactly the condition under which this programme has previously over-claimed.

The research behind all of it

Everything above is a summary. Twelve documents, roughly 130,469 words, every quantitative claim carrying a quoted source and a rating, and every error left standing in the text with the correction beneath it.

Submit a field observation  ·  File a correction — both forms make the provenance fields (where, when, out of what, and what it was for) structurally required, because a count without a denominator cannot be used and a count whose purpose was never stated can be read for the wrong thing.

Silencing the Span: Defining the Manhattan Bridge Rail-Noise Problem in DUMBO for a Design-Build Intervention. Ethical Tech CoLab. Research content released under CC BY 4.0. Not peer-reviewed. No option in any document is recommended for procurement.

This page was generated by build_pages.py from commit 6f6b90d on 2026-08-11. Repository · Open issues